Monday, December 26, 2011

Stocks Float Higher on Light Volume; Euro Still Very Bearish


I want to take a moment to thank you all for another pleasant year here on the blog.  I feel I'm very fortunate to have such an intelligent and friendly group of folks here who read the blog and post their comments for all of us to read.  Also, many of you have clicked the sponsor's links I post here, signed up for Elliott Wave International's free Club Memberships, and even ordered some of their high quality products.  All of the above keep me motivated to continue posting throughout the year.  Hopefully we can continue to get more high quality readers and comments through 2012, and if so I can assure you that I'll be here, posting my thoughts and engaging in discussions with you all so we can help each other navigate these markets better, and learn off each other.  I wish you all a very happy and successful 2012!

Speaking of the holiday season, I hope you're all enjoying it as much as I am.  I'm pretty much just sleeping 9 hours a day, stuffing my face with tons of leftovers which segues nicely into my noon time nap where I wakeup to watch football, eat again, watch a movie and then go to bed.  My goal is to get so fat that I need to be rolled around the house to do basic stuff.  Then, I get back into shape after the New Year.

The market action doesn't mean much to me right now since volume is so light and end of year maneuvering is occurring.  The wave count remains the same with the option of one more new high to around 1300 to mark the end of Intermediate wave (2).  This is not required although it would make more sense as far as the wave count goes.  The move down from my first proposed Intermediate wave (2) high (1292 on Oct 27th) is clearly a 3 wave move, and the behavior since that move has been far from being "wave 3 like" since it has just flopped around sideways on light volume since then.  Another new high around 1300, or just above it, to mark wave (2)'s end followed by sharp selling on high volume would be a much more ideal scenario.  So I'll wait for that to occur to ramp up my short position again.

"Market Manipulation" Is Not Why Most Traders Lose


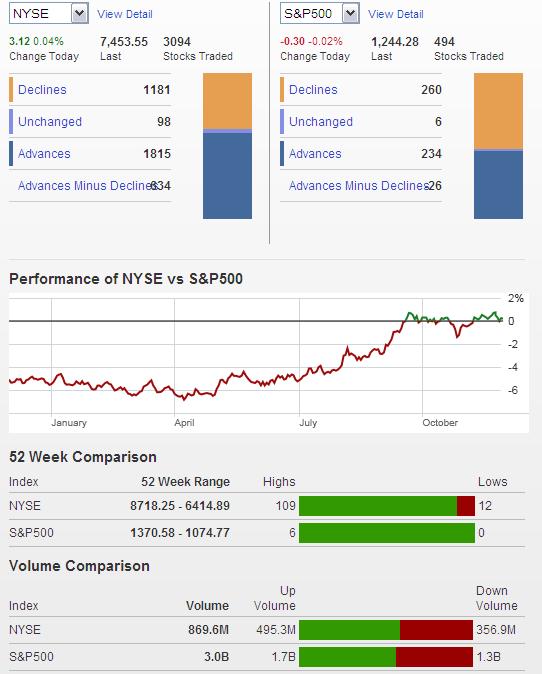
Looking at the S&P's SPDR you can see how volume has fallen off a cliff during the recent rise.  The market can continue to do this for a few more days into the New Year, but I wouldn't be piling up on the long side here.  Once volume re-enters the market after the New Year, stocks should fall.  Until then I wait.......and eat......then take a nap....eat again.....and roll over to the TV to watch the football games.

 Learn Elliott Wave Principle (EWP)


The euro has been a cash cow for the bears the past couple months, again not failing me for the bearish November/December scenario I've talked about the past few years.  The trend remains firmly down.  There is a nice long reversal candlestick wick at the 1.3200 area that suggests strong resistance at that level.  I have my aggressive short position set to stop out on a move just above that level.

Happy New Year to you all!!


PLEASE NOTE: THIS IS JUST AN ANALYSIS BLOG AND IN NO WAY GUARANTEES OR IMPLIES ANY PROFIT OR GAIN. THE DATA HERE IS MERELY AN EXPRESSED OPINION. TRADE AT YOUR OWN RISK.

Wednesday, December 14, 2011

Stocks and Euro Should Continue to Work Lower (Also, Prechter Talks About the Safest Banks)


The wave count and internal structure of the decline is not ideal for the above wave count to hold true.  But just because it's not ideal doesn't mean it's not accurate.  Markets do not like to unfold into perfectly well rounded packages that fit our anaysis methods 100%.  And there are several factors that can explain away the fact that wave (ii) is much bigger than its larger degree wave ((ii)), volume overall is still light, and the market is holding up quite well for what should be a wave 3 at various degrees.  And those factors are that there was a lot of European government interference in the markets the past month, and December tends to be a light volume month anyway.  Now I don't want to try and fit a square peg in a round hole here by imposing my own personal biases onto the market instead of just viewing the market objectively.  So  I'm still cautiously bearish here with stops firmly in place at comfortable levels should this wave count be wrong.

Despite volume being so light, you'll notice a slight advantage for the bears in volume action.  The S&P SPDR's (SPY) volume decreased in the early stages of the previous rally, and now volume is slightly increasing as the market moves lower, with volume exceeding the 20 day MA left by the rally.  Perhaps another sign that a sharp selloff is just around the corner.  So volume is light, but it's all relative.  Also note that the action in the euro is very bearish, and should be very telling of what stocks should do in the near future.

 Learn Elliott Wave Principle (EWP)


Above is the daily EUR/USD chart.  I see nothing here that is bullish.  The structure and behavior of the euro is very bearish here, and I'll continue to be short this market until it proves to me a bottom might be in, i.e. a big reversal day, new daily swing high, etc.  You can see that a major support level in the euro has been broken, and closed beneath, with a daily bar yesterday.  It's possible we'll get a test of the underside of this support level, which is now resistance, around 1.3150 in the near future, but I'm not betting on it.  Only a strong close above 1.3150 would get me to cover some of my short positions and start looking to see if a bottom might be in.  But for now, this thing is pointed lower. 

One last note, I said weeks ago that I was bearish the euro and one of the reasons was that a gap up was made, and left wide open, on a Sunday.  Those gaps almost always get filled within a few weeks, if not a few hours.  The euro's gap was left open for several days, only strengthening the bearish view in my opinion.  Well it finally closed that gap Monday, just as expected.  Okay, here's my Hannibal from The A-Team line, "I love it when a plan comes together."

What Is Backing Your Deposits in the Bank?


December 9, 2011
By Elliott Wave International

Is the bank really the safest place to keep your money? Robert Prechter joins the Mind of Money host Douglass Lodmell to discuss what backs bank deposits and how you can keep your hard-earned money safe.

We invite you to watch the interview below. Then read Robert Prechter's free report, Discover the Top 100 Safest U.S. Banks.


PLEASE NOTE: THIS IS JUST AN ANALYSIS BLOG AND IN NO WAY GUARANTEES OR IMPLIES ANY PROFIT OR GAIN. THE DATA HERE IS MERELY AN EXPRESSED OPINION. TRADE AT YOUR OWN RISK.

Monday, December 12, 2011

Stocks and Euro Topped

I'm short on time today and can't do a full post, but I wanted to say that it looks like a top is in and a major selling phase is underway, i.e. wave (iii) down is just getting started.  To recap from last week, I was looking for a decline Friday and/or today which would be either corrective or a resumption of the larger downtrend, depending on its strength and structure.  I said I'd probably need to see Friday's and Monday's action to get a better idea of which of the two options it was.  Well today's action and internals suggest that the downtrend has resumed, putting my top count way up front, suggesting that wave (iii) down is now getting underway (see prior post below for chart and details).  Keep in mind that oftentimes when I make bold predictions like this the market likes to make a fool out of me and move in the opposite direction hundreds of points.  So as always, I'll be managing risk appropriately.

The euro is in the same boat as stocks and appears to have topped and is heading lower as well.  Last week I said the euro's bearish outlook was a big reason why I liked the bearish stock count since stocks often follow the euro, and today we can see why I put so much emphasis on the euro.  Look for the euro to continue lower, with bumps along the way.

Hopefully I can get a full post in tomorrow.

Learn Elliott Wave Principle (EWP)


PLEASE NOTE: THIS IS JUST AN ANALYSIS BLOG AND IN NO WAY GUARANTEES OR IMPLIES ANY PROFIT OR GAIN. THE DATA HERE IS MERELY AN EXPRESSED OPINION. TRADE AT YOUR OWN RISK.

Thursday, December 8, 2011

The Stock Decline Begins, is it Corrective or Impulsive?; Euro Reversed - Heading Lower


Volume was light relative to normal trading days throughout the eyar but it did kick up a bit relative to the volume that accompanied the recent rally.  It's also some decent volume for a December.  In addition, an overwhelming majority of the volume (96.7%) was to the downside.  So today was a bearish day internally, and in the price action. 

Today's action was in line with the projection I gave in Tuesday's post in that a decline was real close, but unfortunately there's not enough evidence to determine whether this decline is just a correction before moving higher, or if it's the start of the next major selling phase to new lows.  The volume and intensity of today's move coincides with either a C wave, or a larger wave 3.  Since today's decline might be a C wave in a flat correction before moving higher, the bullish outlook still remains just as likely as today's decline being the start of another 3rd wave down.  So we're still mixed here in my view, and need to at least see Friday's and Monday's action before getting a better idea of the larger trend.  But I think a slight advantage lies with the bears because there is still a series of lower highs in place, the euro looks very bearish here, and the risk/reward is very appealing to the bears right now.

Elliott Wave International's Free Price Bars and Chart Patterns Trading eBook


Earlier in the week we saw that the declining volume, mature wave structure, and long candlestick wicks on the daily charts suggested at least a short term pullback was coming soon, and today it came true.  If the above count is correct, the market should be selling off with little rest for the coming weeks.  That may be a tough task to expect for a market heading into a normally positive time of the year.  But we'll see. 

Although the evidence for the bears and bulls are almost even here, there is one piece of evidence that lends itself to the bearish camp for stocks.  And that's the action in the euro.  If stocks continue to track the movement of the euro more or less, and the euro has some serious selling pressure on it right now as it seems, then the bearish stock count above looks more likely at this point.  After Friday, and maybe Monday's action, we should have a better idea of the larger trend and wave count.

Learn Elliott Wave Principle (EWP)


The euro was able to sneak in a new swing high on the hourly chart during the European session but was immediately reversed and sold off to a new swing low.  That type of reversal is extremely bearish.  What's even worse for the bulls is that on the US session's rally later in the trading day, the bears again pushed the bulls down with some heavy money as you can see with the second long wick on the above chart.  These long wicks may mean that some big money is coming in and hammering the euro, preventing it from making any real progress or gaining any momentum.  The bottom line is that the trend remains down and the I remain bearish the euro.  And that's bearish for stocks most likely.


PLEASE NOTE: THIS IS JUST AN ANALYSIS BLOG AND IN NO WAY GUARANTEES OR IMPLIES ANY PROFIT OR GAIN. THE DATA HERE IS MERELY AN EXPRESSED OPINION. TRADE AT YOUR OWN RISK.

Tuesday, December 6, 2011

Stock Retracement Deep, Maybe Too Deep; Euro Consolidating Before Breakout


I was hoping by now the market would be tanking hard as projected and I could give my A-Team Hannibal line of how "I love it when a plan comes together."  But unfortunately, I can't.  I'm not putting much emphasis on the market's internals until after the New Year since volume should be light the rest of the month and there's usually a positive bias right now.  You can see that today's 800 million NYSE shares shows you exactly what I mean.  The interesting note here is that volume was slightly tilted to the negative side, despite the Dow posting a decent gain of 52 points at the close.  When you combine this weak internal structure of the rally today to the wave count and daily bars I discuss below, it tells us that at least a short term top might be nearby.  If nothing else, it's a great risk/reward opportunity for the bears since the retracement is so deep and has now come closer to my stop level just above 1277.55.

Single- and Multi-Bar Price Analysis: Could It Help You Forecast the Markets?


This wave count has become more and more doubtful the past few trading days for two reasons: 1) the smaller degree wave (ii) is much larger than its larger degree wave ((ii)).  This does not violate any EWP rule, but is certainly contrary to EWP guidelines; and 2) the retracement of wave (ii) is very deep, deeper than the usual comfortable level of retracement at 78.6%.  Again this doesn't violate an EWP rule since corrective waves can retrace up to 100% of the preceding move, but the excessive depth of the rally is contrary to EWP guidelines.  So since no rules are violated, the above count is only down, but not out.

One reason I still hold this count as top choice though is that the rally involved governmental interference.  This may interupt the short term gyrations and wave count in the market, but it won't prevent the original larger trend from taking over in the end.  So the two guidelines I mentioned in the previous paragraph have more forgiveness on my part since the wave had government intervention in it.  I know that many wavers disagree with me when I say that external events such as government intervention have an impact on the wave the count at level, but this is just my opinion developed over the past several years of using EWP.  I don't think external influences, such as government intervention, can change the long term trend, I just think it can complicate the short term wave count at times. 

If the above count is correct, the market will stay capped at 1277.55.  A move above this level probably means Intermediate wave (2) is not finished and that I'm going to step aside until I see signs of a top again.

One thing to note as we move forward in the coming days.  Looking at the recent rally which I labeled wave (ii), it looks impulsive on the daily chart above.  This of course would mean the labeling in my chart is wrong and that the larger trend is now actually up.  There are some candlesticks with large wicks on the daily charts that have formed the past few trading session which suggest there is strong resistance at current levels so at least a short term pullback is likely coming.  The reason I wanted to mention all this is because we may get some weakness this week but it MAY not be because the downtrend has resumed but actually just a correction of a 5 wave rally.  So it will be important to get a good definitive wave count on the decline to determine if the decline is impulsive or corrective so we'll have more certainty as to the larger trend.

So a lot of "ifs" and "buts" today which is unfortante.  But I try to just write these posts as objective as possible with all the relavent thoughts I have on the market at the time.  And ufnortunately, the past few days has left some uncertainty.  So managing risk, not maximizing profits, is paramount for me this week.


The euro has obeyed my forecast from last week...........wow, I like how that sounds, it "obeyed my forecast".........anyway, it fell lower after that big reversal candlestick on the 4hr chart I pointed out in last post.  However it has been a bit flat since the initial drop.  Nothing concerning at this point for the bears at this point though, but I'd like to see the euro sell off in the near future to be more comfortable with assuming a top is in.

Download Your Free Price Bars and Chart Patterns Trading eBook


The euro is consolidating on the one hour timeframe.  This means that there is probably going to be a breakout pretty soon, i.e. a sharp and deep move.  Since the euro is not giving us a high confidence wave count, I'm not sure how a consolidation or a triangle would fit in here, and therefore I can't be confident in what direction it will breakout to.  But since it's made a lower high and lower low recently, it could be the start of another major downtrend phase, so I'm not abandoning the bearish outlook due to this currnet triangle like pattern.  I'm just ensuring my stops are in place at comfortable levels because if this thing breaks out against me I want to make sure I'm removed from this market as soon as possible.

The bottom line is that I remain short but have tightened my stop in preparation for the breakout possibly going against me.

Learn Elliott Wave Principle (EWP)


PLEASE NOTE: THIS IS JUST AN ANALYSIS BLOG AND IN NO WAY GUARANTEES OR IMPLIES ANY PROFIT OR GAIN. THE DATA HERE IS MERELY AN EXPRESSED OPINION. TRADE AT YOUR OWN RISK.

Friday, December 2, 2011

Reversal Bar Put in Stocks Today; Euro Reverses as Well


With the holiday season upon us for the next month, internals data will probably be skewed, confusing, and not as reliable as they are most of the year.  So I'm not going to depend on them as much, unless we see a huge spike in volume.

Free 14-page eBook: "Price Bars and Chart Patterns Trading"


Overall there's not much to add to my last post other than today printed a nice reversal bar on the daily chart.  Since the central banks saved the world for the hundreth time earlier in the week, the market has been hard pressed to mount any follow through to the rally.  I suspect this is very discouraging to the bulls and will lead to a big selloff soon.  With volume so light and the holiday season here, I'm not sure how quickly it will be for the decline to materialize, i.e Monday?  Two weeks?  But regardless of the exact timing, financial media is boasting about this week's massive stock gains as if it's bullish, while the technicals suggest the action this week is actually bearish for the weeks ahead.  The market can certainly float higher in light holiday trading, but that's a guess, what's more certain and supported by technical evidence is that the market looks poised to decline hard soon. 

Today's high seems like a good place to put a stop loss for aggressive bears.  For all others, above 1277.55 remains a very solid stop level.

Prechter: "The Trend Is Exhausted"


The euro appears to be in a lot of trouble here.  The gap from this past Sunday is still open, the RSI is diverging on the 4 hour chart, and today's selloff looks like a top is in.  I'm aggressively bearish the euro with a stop just above 1.3550 for my short term trades.

The Trend is Exhausted


PLEASE NOTE: THIS IS JUST AN ANALYSIS BLOG AND IN NO WAY GUARANTEES OR IMPLIES ANY PROFIT OR GAIN. THE DATA HERE IS MERELY AN EXPRESSED OPINION. TRADE AT YOUR OWN RISK.

Wednesday, November 30, 2011

Fading the Rally - Stocks and Euro


I was hoping the market would move as planned so I could go another day without posting something, but the market likes slapping me in the face every chance it gets, so here I am.  If today's rally were just out of the blue, or based on some change in overall sentiment, I'd be concerned about the wave count and longer term bearish outlook.  But the fact that it's due to some government bankers coming up with some nonsense plan to save the world for the 1000th time, I'm not concerned about the longer term bearish outlook at all.  This rally is temporary and I'm fading it (shorting it), but will probably wait until today's close, or sometime tomrorow.

The rally does create some problems for the short term wave count though.  Breaking above 1225 eliminates the wave count the way I previously had it.  And I feel the best way to count the decline now is how I have it above.  The problem is that wave (ii) is larger than wave ((ii)), and since wave (ii) is of a smaller degree then it should also be smaller than larger degree waves.  But it's not.  This structure does not violate any EWP rules, but it is a guideline and one that has served me well in the past to follow.  But the fact that the break of 1225 was due to human banker/government manipulation does make the above count more likely since we can't assume a nice fluid and natural EWP pattern is unfolding when unnatural influences and manipulation have now interfered.  So the fact that the waves are not unfolding perfectly in the face of the intervention today does give me a little more confidence in the above count, despite the guideline being violated.  1277.55 is my stop.  Breaking above that level won't turn me bullish, it just means I have to wait a little longer to short again.

Prechter: "The Trend Is Exhausted"


In the short term 1 hour chart the euro rally looks amazing and it looks as if we should try to get long any chance we get.  But looking at the daily chart you'll see that it looks more like just another bump in the road on the way toward lower levels.  The fact that this rally didn't occur right at a bottom, and that Sunday's gap is still left open, have me wanting to short this rally.  It should be fully reversed soon.

Learn Elliott Wave Principle (EWP)


PLEASE NOTE: THIS IS JUST AN ANALYSIS BLOG AND IN NO WAY GUARANTEES OR IMPLIES ANY PROFIT OR GAIN. THE DATA HERE IS MERELY AN EXPRESSED OPINION. TRADE AT YOUR OWN RISK.

Monday, November 28, 2011

Stocks Bounce to Relieve Severely Oversold Condition, then will Fall to New Lows; Euro Gap is Bearish


I had a nice week off with family and friends, gobbling up turkey all weekend and I hope you all did too.  And speaking of turkey, I feel like one now.....boy did I eat a lot.  I better hit the gym again to train for the next upcoming holiday season gorging I'll be doing in just a few more weeks.

Stocks declined last week despite the fact that it's usually a positive week for stocks historically.  Volume was light, of course, but just the fact that the market declined and couldn't hold a rally is a strong sign to me that there is a strong larger downtrend in place.  But after such a long and slow downtrend it has left the market in severely oversold territory, which has led to today's bounce.  Again the bounce appears to be tied to "hope" of better days in Europe.  And we wavers know this will not result in any sustained rally, so it merely presents a good shorting opportunity.  The count is posted above, the bottom of wave i is my stop level just above 1225.

Prechter: "The Trend Is Exhausted"


The euro popped hard at the open Sunday but has left a huge gap open as a result.  Gaps are usually filled, and there is no reason to doubt that the downtrend is still intact for the euro.  So I'd be shorting rallies, especially until that gap is filled.

Learn Elliott Wave Principle


PLEASE NOTE: THIS IS JUST AN ANALYSIS BLOG AND IN NO WAY GUARANTEES OR IMPLIES ANY PROFIT OR GAIN. THE DATA HERE IS MERELY AN EXPRESSED OPINION. TRADE AT YOUR OWN RISK.

Thursday, November 17, 2011

Bye-bye Mr. Triangle, Stocks and Euro Headed Lower


I have said that I'd like to see the market pick up in volume, to at least 1 billion NYSE shares, and the 1225 level in the S&P be broken in order for me to remove the triangle count and put the aggressively bearish top count up as a far out first choice.  Well, we got both of those things with today's action.  There's still some risk to the short term bearish view with Thanksgiving week right around the corner, but I listen to the charts and internal behavior of the markets more than a loose historical seasonal bias.  The typically bullish week we are about to embark upon should be considered as a part of the overall trading strategy, but in my opinion it shouldn't be the sole reason for making a trade.

From Elliott Wave International, Download "The Most Important Investment Report You'll Read for 2012" Now. (It's FREE until November 30.)


Above is the top count and it is aggressively bearish and means the market should unfold sharply lower in the coming weeks.  Yesterday I eluded to Elliott Wave International's "Short Term Update" bringing an issue related to the triangle.  At the time I didn't want to divulge proprietary information, but now that the triangle is broken I'd like to explain further.  The Short Term Update brought to light an issue that contradicted the likelihood of the triangle scenario playing out.  They (Steve Hochberg) stated that yesterday the Wall Street Journal published a story that an extremely bullish triangle formation was in place.  So of course, the contrarian method of thinking is that if the Wall Street Journal is reporting a bullish triangle is in place, then that means it's a pretty mainstream thought and therefore it most likely will NOT occur.  In yesterday's post, I eluded to Hochberg's statement because I thought it was the strongest piece of evidence against the triangle interpretation.  It turns out Hochberg was very wise to post that analysis yesterday.  The triangle scenario has been eliminated, and the EWP structure suggests the market will head sharply lower soon.

What Are the BEST Technical Indicators for Successful Trading?


The euro rally has been very flat and filled with 3 wave moves as it only progresses sideways as you can see from the above chart.  This is clearly corrective and suggests the euro will head lower soon.  And remember, the last few years I can remember, the euro has been sold off hard during Thanksgiving week.  Like I said for stocks, I don't think these types of historical seasonal biases should be traded on solely, but they should definitely be considered.

Learn Elliott Wave Principle


PLEASE NOTE: THIS IS JUST AN ANALYSIS BLOG AND IN NO WAY GUARANTEES OR IMPLIES ANY PROFIT OR GAIN. THE DATA HERE IS MERELY AN EXPRESSED OPINION. TRADE AT YOUR OWN RISK.

Wednesday, November 16, 2011

Thursday Should Eliminate One of the Two Top Counts; Euro Trend Remains Down


Internals flipped bearish with the declines today and volume increased as well.  915 million NYSE shares traded today which is a strong increase from when the market was pushing higher, however in the big picture this is still fairly weak.  It instills confidence in that in the longer term picture, the trend is still down, but for the short term I'm not sure this lends itself to the start of a wave 3 at various degrees.  But we'll see.

From Elliott Wave International, Download "The Most Important Investment Report You'll Read for 2012" Now. (It's FREE until November 30.)


Again, the top count above is very bearish.  It suggests wave iii of (iii) of 1 of (3) of ((3)) is underway.  Unfortunately, I wouldn't expect to see such deep and long lasting corrective rallies for this structure, and I'd also expect volume to be surging with the declines.  Perhaps the holiday season malaise is already kicking in, but who knows.  The alternate triangle count comes in a very close 2nd but could be eliminated early tomorrow on a break below 1225.  If the triangle is eliminated, then this count above holds strong footing and will be used as a basis for all my trades for the foreseeable future.

What Are the BEST Technical Indicators for Successful Trading?


The alternate triangle count is listed above.  You can see that it's fitting quite nicely into a good consolidative triangle pattern that should be finishing up right now.  The result of this triangle is of course a sharp surge higher to a new high which will then be quickly and completely reversed.  Another strong piece of evidence for this count is how prices reacted to the news that came out about US banks worried that European problems might affect them.  The market sold off sharply in conjunction with this news.  EWP states that E waves of triangles often are the result of some news event, but are the last move of the triangle and result in sharp reversal thrusts to new extremes.  Well the news event about European and US banks led to a decline that fits well for wave ((e))'s placement in the triangle count and it means that early tomorrow the market will undergo a large and sharp thrust higher to above 1300 at a minimum.

A sharp move higher on solid volume would put this count as top choice and give wavers a good opportunity to start establishing short positions above 1300 in my view since thrusts from tirangles are finishing moves are quickly and completely reversed.

A break below 1225 would pretty much erase this count from contention and put the first bearish count post at the top as the best viable count.  For those of you who subscribe to EWI's Short Term Update you saw what Steve Hochberg had to say about the triangle scenario and I feel it's very compelling myself.  It's also a big reason I have the two counts listed the way they are.

Learn Elliott Wave Principle


After a nice clear ABC rally with a B wave triangle in the middle and a C wave that stopped around 78% fibonacci, the euro did what was expected, it fell to a new low.  The euro continues to decline impulsively and rally correctively (3 waves).  I see no reason to abandon the bearish stance here.  I remain short this pair.


PLEASE NOTE: THIS IS JUST AN ANALYSIS BLOG AND IN NO WAY GUARANTEES OR IMPLIES ANY PROFIT OR GAIN. THE DATA HERE IS MERELY AN EXPRESSED OPINION. TRADE AT YOUR OWN RISK.

Monday, November 14, 2011

Stock Triangle PIcking up Traction; Euro to Correct Higher, then Fall Hard Again


Internals suggest that the usual market participants had better things to do today.  Only 709 million NYSE shares were traded today, surely one of the slowest trading days of the year.  When you combine this with the price action it lends itself more to the triangle alternate count I mentioned yesterday.  With Thanksgiving coming up next week, a week that's typically good for stocks, it's possible we might just float around in a net sideways-to up market for the next couple of weeks.

America's First Deflationary Depression: Is a Bigger One Ahead?


With volume so light on today's move, it would seem more likely that today's weakness was corrective, and that a new high is still on the way.  But seeing as that the correction from the Wave i low would be getting quite elongated, along with the unorthodox look of wave (iii) down that's supposed to be underway right now, it means this count is losing steam.  If this count is on track still, I'd like to see a sharp and quick pop to a new high tomorrow followed by a sharp reversal, or the market just fall hard with solid volume (above 1 billion NYSE).  Anything other than that would lend itself more to the below triangle scenario, or perhaps something else entirely.


The sideways action over the past month or so, along with decreasing volume numbers, fit well into the triangle scenario shown above.  If so, this would fit somewhat nicely into the upcoming holiday malaise we should see for the next week or so.  I think tomorrow's price action and internals will be very telling on which of the two above counts are most likely in play.

Learn Elliott Wave Principle


One of the reasons the more bearish count is still my top choice at the moment is the wave count in the euro.  The euro appears to have topped and reversed again aftern an exhaustion gap up from Sunday.  The resultant decline looks impulsive, again furthering the case for a top and bearish reversal.  Yet stocks did not follow the euro's intensity to the downside today.  This tells me that perhaps the upcoming corrective euro rally with fall short of making a new high, yet stocks might make a slight pop up to a new high before reversing, creating an intermarket divergence I would see as very bearish.  So I still think it's better to be short the euro here.  And aside from stocks, the past few years the Thanksgiving holiday has been very bad to the euro and great for the US dollar.  If that holds true again this year, it means heavy selling is just ahead for the euro, and the wave count above supports this outlook.


PLEASE NOTE: THIS IS JUST AN ANALYSIS BLOG AND IN NO WAY GUARANTEES OR IMPLIES ANY PROFIT OR GAIN. THE DATA HERE IS MERELY AN EXPRESSED OPINION. TRADE AT YOUR OWN RISK.

Sunday, November 13, 2011

Volume Numbers Continue to Suggest the Stock Rally is Corrective; Euro Topping


From an EWP perspective the rally is getting very deep.  After a nice top and reversal for wave (ii) at the 78% fibonacci retracement level of the previous decline we got a very nice and sharp selloff which was encouraging for the bears.  But the ensuing rally has gone quite deep, yet has not made a new high.  Therefore the above count remains valid.  But I expect a top to be in now, or with just one more quick pop higher tomorrow morning before the heavy selling returns.  But that "pop" higher is not necessary, looking at the euro we may get immediate weakness right at the open tomorrow.  Either way, the risk/reward favors the bears here.

The count on the back burner is the possibility that a triangle is forming which means Intermediate wave (2) is not complete, and that the larger downtrend has NOT resumed.  This would also be another explanation for the decreasing volume the past few trading days.  I don' t see this count as top choice right now though, but with the holidays approaching and the weak volume right now and sideways price action, this count is gaining traction as a strong possibility.  A break above 1277 would put this triangle alternate on the table.

Learn Elliott Wave Principle


Volume supports the EWP count in that last week's rally has been on severely weakening volume.  As I hinted in my last post, the Veteran's Day holiday Friday brought the market a nice rally but did so on weak volume at only 745 million NYSE shares.  So the masses aren't taking part in the rally, at least not yet.  So for now, price action relative to volume gives a bearish outlook for stocks right now. 

America's First Deflationary Depression: Is a Bigger One Ahead?


The euro looks to be topping here.  Using basic EWP analysis it appears a nice ABC correction is complete with wave B being a triangle.  Although I don't have a longer term count that's reliable, it doesn't mean we can't us EWP basics to get a good idea of the shorter term action.

The 78% fibonacci retracement of the previous decline has been reached and slightly exceeded, making it the preferred maximum retracement possible to still reliably count this rally as a correction.  The fact that the RSI and stochastics diverged on the recent new high at today's gap open, and that it looks like an exhaustion gap since it was immediately reversed after a big rally, the euro may be topping here.  I'm looking for the euro to head sharply lower now and the risk here is tight, i.e. either at today's high or 1.3860.

PLEASE NOTE: THIS IS JUST AN ANALYSIS BLOG AND IN NO WAY GUARANTEES OR IMPLIES ANY PROFIT OR GAIN. THE DATA HERE IS MERELY AN EXPRESSED OPINION. TRADE AT YOUR OWN RISK.

Thursday, November 10, 2011

Stock and Euro Rallies are Weak, Larger Trend is Down


Today's price action was strong in that we got a triple digit Dow rally, but other than that, the move today looks quite weak.  The S&P lagged the Dow slighty, but the Nasdaq lagged big time as it struggled to just close in positive territory.  Also, the rally never really got any legs to push higher and hold itself higher, and as a result it so far looks weak and choppy on the hourly charts, which is corrective.  But this is subjective I suppose, but what's hard fact is that the internal composition of today's rally was quite weaker than what accompanied the decline yesterday.  Here's what I mean:

Today's up volume was 71.8% of total NYSE volume while yesterday's down volume was 98.5% of total volume.  Total NYSE volume today was 895 million while yesterday's was 1.1 billion.  Today had 409 S&P stocks closing higher while yesterday had 499 stocks close lower.  And today, the NYSE had 2.3 advancers for every one decliner while yesterday had 9.6 decliners for every one advancer. 

So clearly, the data we have from the last two days suggests today's action is simply just correcting the extreme bearish move from yesterday.  The larger trend is down.

America's First Deflationary Depression: Is a Bigger One Ahead?


The wave count supports the internals' analysis above.  Minuette wave (ii) ended right at the 78% fibonacci retracement level of the previous decline and sold off sharply after doing so.  Today's bounce is choppy and internally weaker than the previous decline, and when you combine it with the fact that the price action looks choppy and weak so far, it has me concluding that today's move high is corrective.

Tomorrow is Veteran's Day so volume will probably be light.  And looking at the price action is seems there is a little more work to do to correction Wednesday's massively bearish selloff.  So I can see tomorrow being an up-day on light volume.  But that is fine with me, just another opportunity to add to my shorts with tightened risk at 1277.

Learn Elliott Wave Principle


I'm getting close to developing a confident wave count for the euro, and it is aggressively bearish as you might guess.  There is no reason to think the euro's larger trend is anything but down at this point.  After the last large euro decline it could only manage a weak 38% retracement while US equities made a 78% retracement.  So I'm not expecting fireworks to the upside for the euro in the coming days either.  Regardless, the 1.3850 level should act as a solid ceiling to cap euro rallies, leaving a good clear and somewhat close stop loss level for the bears.

How Do You Get from Dow Theory to Elliott Wave Analysis?


PLEASE NOTE: THIS IS JUST AN ANALYSIS BLOG AND IN NO WAY GUARANTEES OR IMPLIES ANY PROFIT OR GAIN. THE DATA HERE IS MERELY AN EXPRESSED OPINION. TRADE AT YOUR OWN RISK.

Wednesday, November 9, 2011

Stocks and Euro Top, Look out Below!


Judging by the internals and price action today, all signs point to another significant top yesterday.  Adding to this is the fact that the S&P cash index topped and reversed right on the fibonacci retracement level of 78%, a common place for second waves to end.

Today's internals were extremely bearish with only 1 S&P stock closing higher, 98.5% of NYSE volume to the downside, and 9.6 decliners for every 1 advancer on the NYSE.  When you add everything together, the market is tracking the wave count well and it means that heavy selling to much lower levels is ahead of us.  The only "question mark" out there for the short term is how the Thanksgiving and Christmas holidays will play on the markets since they tend to be composed of light volume rallies for the market.  Yet the wave count suggests aggressive selling in the coming months.  We'll see. 

For my charts and wave count see yesterday's post below.

Learn Elliott Wave Principle


PLEASE NOTE: THIS IS JUST AN ANALYSIS BLOG AND IN NO WAY GUARANTEES OR IMPLIES ANY PROFIT OR GAIN. THE DATA HERE IS MERELY AN EXPRESSED OPINION. TRADE AT YOUR OWN RISK.

Tuesday, November 8, 2011

Stocks Retracement is Deep, But Ending Soon; Euro Can't Get Off the Mat


Nothing really new or exciting has occurred since the last post.  Still watching and waiting for a reversal and don't see it yet.  Stocks only "paused" at 61% fibonacci and are attempting to launch an attack on the 78% fibonacci retracement level at 1276.  Deep retracements are not uncommon for second waves.  The key is that 1292.66 remains intact.  And as long as it does remain intact, I view the market as very very very vulnerable to a serious decline.  The risk/reward favors the bears big time here.  I can always be wrong, so I'm not betting every cent I have on the move, it's just that probabilities and the risk/reward strongly favor the short side here with a stop just above 1292.66 - in my opinion.

The current rally still looks corrective.  It continues to be choppy and uninspiring internally as volume continues to decline as prices rise.  And the euro is having trouble getting off the mat, suggesting the appettite for risk is muted as people are still trusting the US dollar versus the euro currency at this time.  That to me is a subtle sign of the real internal risk appetite of the fiinancial markets with all this Europe mess going on.  Risk taking is muted, yet hope is strong; a combination for nice selloff soon.

Earnings: Stock Market's Brightest False Beacon


Here's what I mean about the euro not being able to get up off the mat.  It is having trouble getting through even the 38% fibonacci level, despite US stocks rallying towards their 78% fibonacci level.  To me, this divergence between the two markets suggests that the stock rally represents the "hope" that everything is okay and anticipation of a strong market in the coming months, while the weakness in the euro shows the true underlying feelings of the global financial markets which is one of fear and restraint.  That's bearish. 

Risk is wide here on the euro since it can rally to almost 1.4250 before topping, so I have decent short position on now and will add shorts on rallies, or on signs of a reversal.

How Do You Get from Dow Theory to Elliott Wave Analysis?


PLEASE NOTE: THIS IS JUST AN ANALYSIS BLOG AND IN NO WAY GUARANTEES OR IMPLIES ANY PROFIT OR GAIN. THE DATA HERE IS MERELY AN EXPRESSED OPINION. TRADE AT YOUR OWN RISK.

Thursday, November 3, 2011

Stocks Pause at 61% Fibonacci, Euro at 38% Fibonacci....Are Tops In?


The market threw a head fake to the bears with the early morning decline then rally.  Not to mention the futures and euro were down big in overnight trading.  So it's been a wild 24 hours for the markets.  All eyes may be on Greece and every little move they do, but we wavers could care less since we know that for the longer term, Greece moves mean nothing.  We watch the wave count, and the wave count is very bearish.

Internals were mixed today as total volume kicked up to 1.05 billion NYSE shares, a slight uptick from yesterday's 955 million shares but still well short of the 1.3 billion shares traded on Tuesday's decline. S&P advancers stayed about the same at 455 from 448 yesterday, but only 85% of total volume was to the upside compared to 90% yesterday.  So the market had solid internal strength, but nothing jaw dropping to suggest any momentum is being picked up on the move the upside.  The rally still looks corrective.

Free eBook Included in EWI Article, "How You Can Make Yourself a Better Trader"


The S&P is primed for another decline as early as tomorrow (Friday).  The S&P filled its gap at 1253.16, and has paused so far at the 61% fibonacci retracement level of the previous decline.  Stocks can drop as early as first thing tomorrow morning.  If not, then they may want to push towards 1276.  Either way, the risk/reward here favors the bears right now.  Again, as long as 1292.66 remains intact I remain firmly bearish and will continue to short rallies.

Learn Elliott Wave Principle


The euro also did a head fake to the bears this morning but has not performed nearly as well as stocks have.  You can see this clearly with the comparable fibonacci retracements of the two.  Stock have so far retraced 61% of their previous decline while the euro has only retraced 38%.  The euro usually leads the stock market so this lagging behavior in the euro might be telling.  Here too the euro looks poised to fall hard again at any moment.  Since stocks and the euro should fall together, and stocks are already at the 61% retracement level, I doubt that the euro's correction will go much past the 50% retracement level at 1.3925 if it decides to continue higher in the short term.


PLEASE NOTE: THIS IS JUST AN ANALYSIS BLOG AND IN NO WAY GUARANTEES OR IMPLIES ANY PROFIT OR GAIN. THE DATA HERE IS MERELY AN EXPRESSED OPINION. TRADE AT YOUR OWN RISK.

Tuesday, November 1, 2011

Stocks Form Major Top, Destruction Just Beginning; Euro Topped, Headed Much Lower: plus Wednesday's Addendum


Wednesday's Addendum: I've posted my thoughts on where we're at in the market in yesterday's post below, but right now I just wanted to put up a quick update on today's action.  Although the rally was fairly strong as far as price is concerned, internally it did not exceed the intensity of yesterday's decline.  For example today's S&P advancers were 448 vs. yesterday's decliners at 479, today's up volume was 90% of total volume while yesterday's down volume was 93%, and most importantly in my view today's total volume was a weak 955 million NYSE shares vs. yesterday's 1.3 billion shares.  So this rally has the internal makeup of a correction, suggesting the larger trend remains down and this week's lows will be broken soon.  This corrective rally either finished at the high today, or might do so with one more leg up to a new a brief new high.  But either way, 1292.66 should remain intact, giving the bears a clear risk level.

Tuesday's Post:

Usually I refrain from making bold statements like that in today's title since usually when I do it the market does the opposite of what I say, stamping the word "fool" on my forhead.  But I want it to be crystal clear what my outlook is now for the market looking ahead.  I will try to analyze the short term movements of the market in the coming weeks/months, which means anticipating relief rallies, but I want to drive home the "bottom line", which is the big picture.  And the big picture tells me that as long as 1292.66 remains intact on the S&P cash index, stocks are extremely vulnerable to a major selling phase in the coming months which could result in over 50% of value lost.  And although the greedy little monster in my head will whisper in my ear constatnly to leverage every penny I have in derivative-type trade shorting stocks, I also need to always keep in mind that no matter how sure I am of the market's direction, I could be wrong, and I need to always protect myself.

Now to the markets.  So another failed attempt for a "man-made" stock market recovery from the government....this time in Europe.  Last week the Dow popped 400 points on government intervention.  Some common investors I know were giving me jazz because the day prior I suggested they protect their retirement accounts by putting them in all or mostly cash.  But with a rally based on government intervention it was nothing more than a sell signal for me, and I told them that.  This week now has me giving those same people jazz back, lol.  It's all in good fun.  Governments around the world will attempt to stop the implosion, and will cause short term pops only, and in the end they will all fail.  Primary wave ((3)) will do what it wants to do and only stop when it is done destroying almost everything in its path.  There's nothing any person or government can do to stop that.  The crowd is in control, and the crowd always overpowers governments and individuals, i.e. Warren Buffet, et al.

The internals today were very bearish in that 84% of NYSE stocks traded lower, 479 S&P stocks traded lower, and 93% of total NYSE volume traded to the downside.  Total volume was just under 1.3 billion NYSE shares, which is not jaw dropping, but volume should increase as Intermediate wave (3) progresses downward.  So overall, a very bearish day in price action and internals.  When combined with the wave count and other technical indicators, it looks like a major top is in.

How You Can Make Yourself a Better Trader


Updating the S&P chart I've been posting the past few weeks, we can see that this top is a major one as far as EWP is concerned.  This week's declines should be the start of Intermediate wave (3) within Primary wave ((3)).  So a 3rd wave within a 3rd wave is now underway.  This is a Waver's dream trade here.  And what it means is that this market should move lower in a hurry, destroying support like it's paper thin.  And since 3rd waves tend to do whatever they want to do and ignore most technical and fundamental indicators, it's wise to ensure I don't get in its way.

With that said, the hourly charts show that the S&P probably has to make one more new low to complete a nice 5 wave decline from 1292.  This will probably occur tomorrow morning.  It's possible a sharp recovery rally will then take place.  But as long as it stays below 1292, I will be aggressively shorting that rally, IF IT EVEN OCCURS.

Bottom line: if the above count is correct, it means that over 50% of the value in the stock market should get erased in a very short period of time.  Needless to say, I'm short.  My stop is just above last week's high at 1293.

Learn Elliott Wave Principle


The euro is getting destroyed.  The European "save the day" news only lasted about a day.  And now, as usual, the markets realize the financial system as we know it is still doomed.  So the dollar is back on fire again, crushing the euro in a 5 wave move as you can see in the above chart.  Here too I will be aggressively shorting rallies as long as last week's high remains intact.

Free Trader's eBook Until November 7th, 2011 from EWI


PLEASE NOTE: THIS IS JUST AN ANALYSIS BLOG AND IN NO WAY GUARANTEES OR IMPLIES ANY PROFIT OR GAIN. THE DATA HERE IS MERELY AN EXPRESSED OPINION. TRADE AT YOUR OWN RISK.

Monday, October 31, 2011

Stocks Go Flat After Big Rally Last Week; Evidence of Euro Top Mounts

Nothing has really changed since my last post as you'll see the same daily chart above that I've been posting for quite a while now.  Stocks are in the targeted reversal zone between the 61% and 78% fibonacci retracement levels, a common place for second waves to top.  What's important, aside from stocks having trouble gaining ground inside my reversal zone, is that after Thursday's monster rally from europe "saving the financial world" is that Friday was flat, and today is so far negative........meaning there has been abosolutely no follow through to the great save the world news and big rally last week.  Now today's trading isn't over and we could sure see a monster rally into the close.  So I'm not getting too excited here, nor am I calling a top at this moment.  All I'm saying is that so far we've had no follow through to the big rally last Thursday, and stocks are stalling in the reversal zone I've cited, two bearish signs.

The action into the close will be telling.  And keep in mind, it's the last day of the month so end of month trading can make things a bit whacky.  I have a feeling this week could get pretty wild as November gets underway, and it's a month that has been particularly brutal to the euro in past years which could be reflective of what will happen to stocks.

Free Trader's eBook Until November 7th, 2011 from EWI


And speaking of the euro, here she is.  On the daily chart you can see the top from last week took place at a very convenient spot, the 78% fibonacci retracement level.  If the big bearish candlestick on the day holds into the close, I will definitely be taking another stab at the short side on this pair.

Learn Elliott Wave Principle


In addition to the reversal right at 78%, the euro declined from the high in five waves.  This in-and-of-itself is enough to get EWP bears in on the short side in my opinion.  I'd like to get a nice bounce from here to give me better positioning on the short side though.  And when you combine this with the fact that November, and especially the Thanksgiving US holiday, tend to be very bearish for the euro, it definitely has me salivating to short this pair soon.

PLEASE NOTE: THIS IS JUST AN ANALYSIS BLOG AND IN NO WAY GUARANTEES OR IMPLIES ANY PROFIT OR GAIN. THE DATA HERE IS MERELY AN EXPRESSED OPINION. TRADE AT YOUR OWN RISK.

Thursday, October 27, 2011

Stocks Well Into Reversal Zone; Euro Slaps Me

Tuesday I thought a top in stocks might be in, but was unsure.  Then the big euro reversal yesterday made me think a reversal in both the euro and stocks was at hand.  Well, you know the result of that thinking.  If the top I'm looking for is in fact Intermediate wave (2) of Primary wave (3), then it will be a doozy when Intermediate (3) gets underway to the downside, and a big money maker for the sage bears.  However, I can almost guarantee you that catching this monster top will not be easy.  And that was proven to me yesterday.

But being wrong in the short term does not make me wrong in the longer term.  With the high on the year still intact, stocks are right in the typical topping area for 2nd waves right now, and the fact that this rally is based on some bailout nonsense in Europe, I feel this is simply just another time for me to nibble on the short side some more.  I'll get more aggressively short on a nice reversal day, or simply a sharp decline on very bearish internals.  But I have little doubt this market will not make it easy on me.  I just have to put my emotions in a box, lock them up, and keep them under the bed for now so I don't do anything stupid.

Free Trader's eBook Until November 7th, 2011 from EWI


Looking at the euro chart I posted yesterday it still looks great for a top and reversal and has me salivating to get short.  Then when I look at the above chart from this morning, I think I'm an idiot for wanting to get short.  But that's the market.  Right around major reversals in likes to suck you in and then slap you, making you feel stupid in front of your friends.  And this slap hurt, I tried twice to short this pair yesterday and got stopped out twice.  I'm waiting now for another reversal sign and will try again.  I'm not giving up simply because I was wrong yesterday.  Being wrong is part of trading.  It will happen, and happen often.  The key is to adhere to the bottom line we all have, which is to make money trading.  Well, that's what I plan to do.....make money shorting the euro.  Yesterday's decline looks like a 4th wave and the 5 wave rise into this morning looks like a 5th wave at some degree.  I'm not sure if it will subdivide further into 4th and 5th waves so I'm going to wait for now.  The top in the euro should align with stocks more or less.

Learn Elliott Wave Principle


PLEASE NOTE: THIS IS JUST AN ANALYSIS BLOG AND IN NO WAY GUARANTEES OR IMPLIES ANY PROFIT OR GAIN. THE DATA HERE IS MERELY AN EXPRESSED OPINION. TRADE AT YOUR OWN RISK.

StatCounter